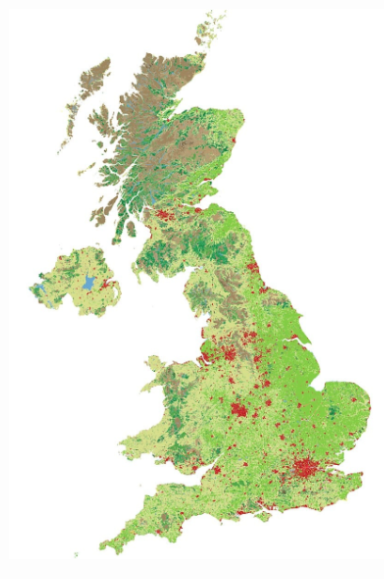
A posting at the website of Local Authority Building Control in the United Kingdom (UK) summarizes what has been learned about land use in that country via analysis of high definition satellite images.[1] Based on these digital images, maps were created consistent with CORINE (coordination of information on the environment) Land Cover protocol of the European Environment Agency.
Key land classifications include:
- continuous urban fabric--the most built-up urban areas, where at least 80% of the land surface is built on and up to 20% is gardens or small parks
- discontiguous urban fabric--where 50% to 80% of the land surface is built on
- Industrial and commercial areas
- green urban areas -- golf course, football fields, parks, etc
- farmland--pasture, arable land, vineyards and orchards
- natural land--forests, lakes, and moors (low growing vegetation on acidic soils)
Interestingly, continuous urban fabric (CUF) only accounts for 0.1% of UK land and discontiguous urban fabric accounts for 5.6% of the land area.
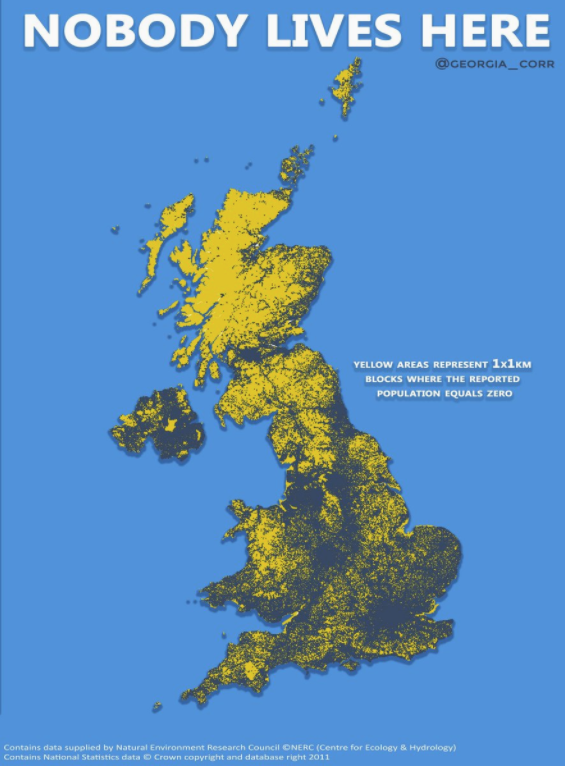
A map posted on Twitter by @georgia_coor highlights those areas of the UK where nobody lives.
[1] Local Authority Building Control is a network of approximately 3,000 professional surveyors. It represents all local government building control teams in England and Wales. Their goal is to ensure buildings are safe, healthy and efficient to meet the standards set by the building regulations.